Skip to content

Data Science & Business Analytics

Warsaw, Poland

Arda Üzer

Data Scientist & Business Analyst

Transforming complex data into meaningful insights through analytics, statistical modeling, and machine learning.

Methods
Statistics · ML
Languages
Python · R · SQL
Based in
Warsaw, Poland

Fig. 01

Illustrative scatter plotUnlabelled observations scattered with no visible structure.feature x →feature y →
Unlabelled observations.

01About

Engineering rigor, applied to questions that matter.

I’m a data scientist and business analyst with a foundation in computer engineering. My work sits where rigorous analysis meets practical decisions: exploring data carefully, building statistical and machine learning models, and explaining what the results mean for the people who need to act on them.

Engineering taught me to break problems down, question assumptions and build solutions that are reproducible. I bring the same discipline to analytics — from data cleaning and feature engineering to model selection, validation and interpretation.

I’m currently completing my MSc in Data Science & Business Analytics at the University of Warsaw, with a particular interest in statistical modeling, unsupervised learning and machine learning applied to real business questions.

Focus
Statistical modeling · Machine learning · Business analytics
Background
Computer Engineering (BSc), Izmir University of Economics
Currently
MSc Data Science & Business Analytics, University of Warsaw
Based in
Warsaw, Poland

How I approach a problem

  1. 01

    Frame

    Translate a business question into a measurable analytical problem with explicit assumptions.

  2. 02

    Explore

    Clean, profile and visualize the data to understand its structure, quality and limits.

  3. 03

    Model

    Apply statistical and machine learning methods, engineer features and validate the results.

  4. 04

    Communicate

    Turn findings into clear visuals and recommendations that stakeholders can act on.

02Expertise

A toolkit for the full analytical cycle.

From querying and cleaning data to modeling, interpretation and visualization — the languages, methods and tools I use to move from raw data to insight.

Programming & Query Languages

  • Python01

    Analysis, machine learning, notebooks

  • R02

    Statistics, modeling, visualization

  • SQL03

    Querying, joins, aggregation

AData Science & Machine Learning

  • Exploratory Data Analysis
  • Statistical Modeling
  • Machine Learning
  • Unsupervised Learning
  • Feature Engineering
  • Data Mining
  • Dimensionality Reduction

BLibraries & Frameworks

  • Pandas
  • NumPy
  • Scikit-learn
  • ggplot2
  • dplyr
  • arules

CVisualization & Tools

  • Matplotlib
  • Seaborn
  • Jupyter Notebook
  • RStudio
  • Git
  • GitHub

03Selected work

Projects

Analyses and systems built end to end — from raw data and method choice to results that can be interpreted and explained.

Fig. P.01Schematic
Association rule mining schematicA user-by-title matrix where each row is one user's basket of highly rated titles. Titles B and D frequently appear together, producing the rule: users who like B also tend to like D, described by support, confidence and lift.TransactionsABCDEFu1u2u3u4u5u6Rule{B} ⇒ {D}supportP(B ∧ D)confidenceP(D | B)liftconf. / P(D)
Method sketch — users as transactions, liked titles as items, rules from frequent itemsets.

P.01Unsupervised learning · Data mining

Anime Preference Analysis with Association Rules

An unsupervised learning project in R that applies the Apriori algorithm to anime rating data to discover which titles tend to be liked together — the same idea behind market basket analysis and recommendation systems.

  • Modeled each user as a transaction and each highly rated title (rating ≥ 8) as an item
  • Focused on the 200 most popular titles to keep the discovered rules interpretable
  • Mined association rules with arules and explored them visually with arulesViz

Technologies

  • R
  • arules
  • arulesViz
  • dplyr
  • Association Rule Mining
  • Data Mining
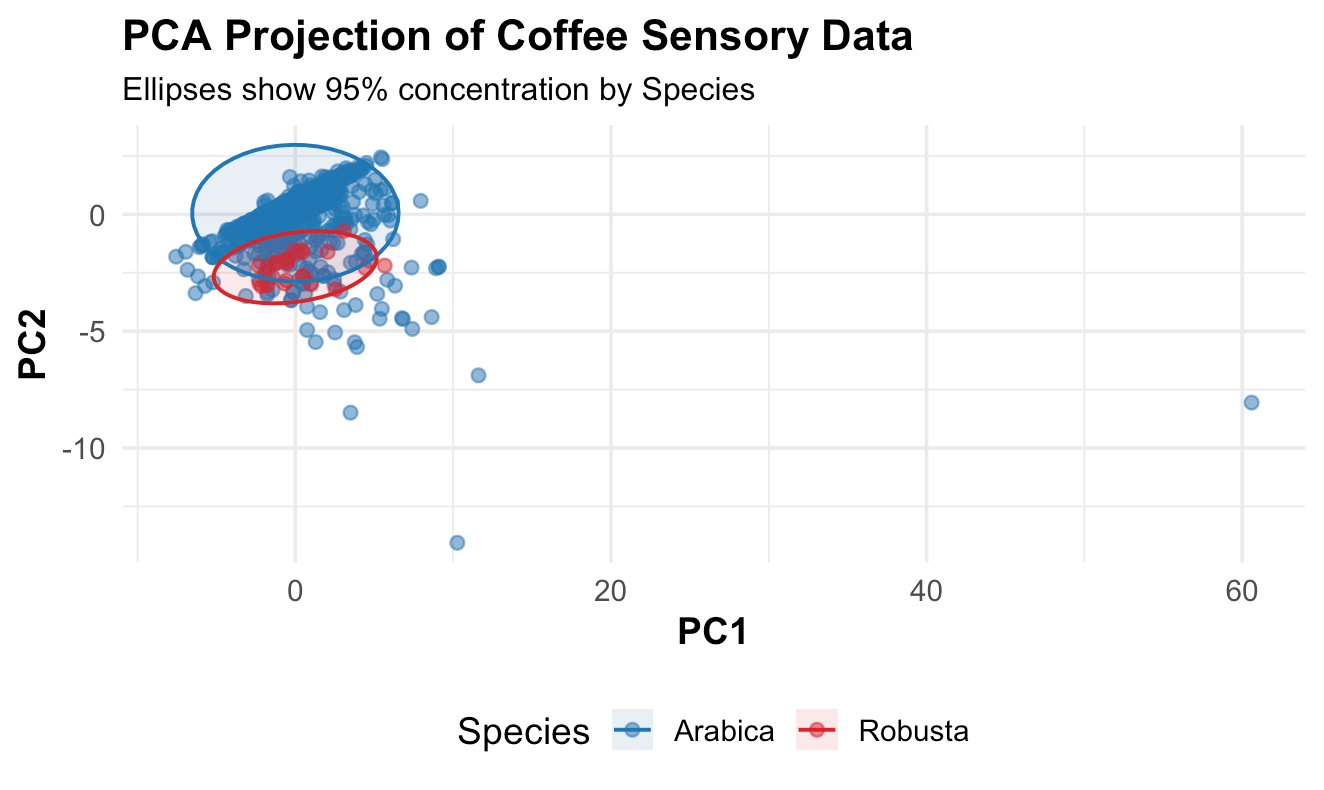
Fig. P.02Output
PCA projection of coffee samples on PC1 and PC2, with 95% concentration ellipses for Arabica and Robusta.
Project output — figures produced in R.

P.02Dimensionality reduction · Statistical analysis

Coffee Sensory Analysis with PCA & MDS

An exploration of the multivariate structure of Arabica and Robusta coffee sensory scores — aroma, flavor, acidity, body and more — using correlation analysis, Principal Component Analysis and Multidimensional Scaling.

  • Examined the correlation structure between sensory attributes
  • Used the scree plot and variable loadings to interpret the principal components
  • Compared Euclidean and Manhattan MDS to see how the distance measure shapes the result

Key finding

The first principal component explains about 58.8% of the variance, and the projections show a noticeable separation between Arabica and Robusta samples.

Technologies

  • R
  • PCA
  • MDS
  • ggplot2
  • dplyr
  • factoextra
  • Statistical Analysis
Fig. P.03Schematic
Cosine similarity schematicPlayers drawn as performance vectors from a shared origin. Players A and B point in similar directions, so the angle between them is small and their cosine similarity is high; Player C points elsewhere and is less similar.feature space →Player APlayer BPlayer CθSimilaritycos θ = A·B / (|A| |B|)smaller angle → more similar
Method sketch — players as feature vectors; similarity as the angle between them.

P.03Similarity analysis · Feature engineering

ATP Tennis Player Similarity Analysis

Turns match-level ATP data (2000–2025) into player-level performance profiles and uses cosine similarity to identify comparable players — with SQL for storage and aggregation, and an interactive Streamlit dashboard for exploration.

  • Engineered player-level features by season and surface from match records
  • Stored and aggregated the data in SQLite and computed similarity with scikit-learn
  • Built a Streamlit dashboard to explore similar players interactively

Key finding

Similarity depends strongly on season and surface — single statistics alone are not enough to describe comparable players.

Technologies

  • Python
  • SQL
  • SQLite
  • Pandas
  • Scikit-learn
  • Cosine Similarity
  • Streamlit
Fig. P.04Schematic
Symptom Evaluation System architecture sketchPatients use a Flutter application to book appointments and submit symptoms with severity levels and comments. A Go REST API handles the requests and stores the records, and doctors review the information before the in-person visit.Appointment flowData storeappointments · reportsPatientFlutter appbooks appointments,reports symptomsAPI serviceGo · RESThandles requests,stores recordsDoctorFlutter appreviews symptomsbefore the visit
Architecture sketch — based on the published system description.

P.04Software engineering · Digital health

Symptom Evaluation System

Team project · co-authored IEEE paper

Undergraduate final thesis: a web and mobile application that supports communication between patients and healthcare professionals. Patients book appointments and report symptoms with severity levels and comments, so doctors can review them before the visit.

  • Cross-platform client for web and mobile built with Flutter
  • REST API service written in Go
  • Presented at the 2023 Medical Technologies Congress (TIPTEKNO 2023), with an IEEE publication

Technologies

  • Flutter
  • Go
  • REST API
  • Web & Mobile Development

04Contact

Let’s turn data into decisions.

Open to Data Science, Data Analytics and Business Analysis opportunities in Poland and across Europe.